
Tworzymy pierwszą transformację w Apache Flink
Programy i przepływy danych
Podstawowymi programami w Apache Flink są strumienie i transformacje. Koncepcyjnie strumień jest (potencjalnie niekończącym się) przepływem rekordów danych, a transformacja jest operacją, która pobiera jeden lub więcej strumieni wejściowych (źródło) i w rezultacie generuje jeden lub więcej strumieni wyjściowych. W krokach opisanych poniżej stworzymy transformację - batch który pobierze informacje z jednego źródła i zapisze informacje do innego miejsca (nazywanych we Flink 'sinks').
Język i środowisko
Programy Flink można pisać w trzech językach; Scala, Java, Python. Ponieważ Flink napisany jest w Scala, ten język jest najbardziej naturalny. Kodowanie w Java jest także wygodne. Pisanie programów Flik w Python nie jest zbyt wygodne (wymagany interfejs miedzy programem Python a Flink).
Nasz pierwszy program napiszemy w Java. Środowiskiem w którym go stworzymy będzie Eclipse IDE. Program można pobrać ze strony Eclipse - https://www.eclipse.org/ide/.
Opis instalacji i konfiguracji Flink znajdziesz we artykule "Uruchomienie Apache Flink w Windows"
Uruchomienie Apache Flink w Windows
Jak zainstalować Apache Flink w środowisku Windows.
Czym jest Apache Flink pewnie wiesz skoro to czytasz. Dla tych którzy tego nie wiedzą: Apache Flink to otwarta, ujednolicona platforma przetwarzania strumieniowego i przetwarzania wsadowego opracowana przez Apache Software Foundation. Rdzeniem Apache Flink jest rozproszony silnik przepływu danych strumieniowych napisany w Javie i Scali. Flink wykonuje dowolne programy przepływu danych w sposób równoległy i potokowy.
Flink do wersji 1.7.X zawierał w katalogu 'bin' plik 'start-cluster.bat' który pozwalał na uruchomienie Flink w środowisku. Nowe wersje nie zawierają tego pliku - Flink musi być uruchomiony w inny sposób.
Co jest potrzebne do uruchomienia Flink?
GitHub CLI (command line interface)
Instalacja Java
Zainstaluj JRE lub JDK w wersji 11. Flink powinien działać nadal z wersją 8 ale nie jest już oficjalnie wspierana przez nich. Funkcjonowanie z wersją 17 jest w opracowaniu. Utwórz zmienną JAVA_HOME w systemie.
Pobieranie Flink
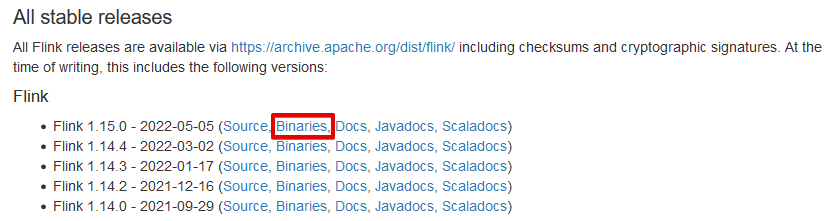
Pobierając Apache Flink, wybierz "binaries" ze strony produktu a następnie plik z rozszerzeniem 'tgz' (zwykle piewszy z góry), np: 'flink-1.15.0-bin-scala_2.12.tgz'
Rozpakuj flink do docelowego katalogu np. "C:\dev\flink-1.13.6\"
Pobranie GitHub CLI
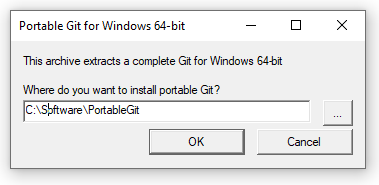
Pobierając GitHub CLI możesz poprzestać na wersji portable - nie musisz instalować tego programu na stałe. Rozpakuj program do docelowego katalogu:
Tworzymy pierwszy potok i przepływ w Apache Hop
Z artykułu Pierwsze kroki w Apache Hop dowiedziałe(a)ś się podstaw o Apache Hop i jak zaprojektowane jest środowisko tego ETL. W tym artykule dowiesz się jak stworzyć pierwszy potok i jak wykorzystać go w przepływie pracy.
Budujemy potok
Zbudujemy bardzo proste zadanie w ETL które otworzy plik, dokona odpowiednich zmian, zapisze zmienione dane i przekopiuje plik do docelowego katalogu. Zadanie jest trywialne ale tworząc je, będziesz mieć okazję do zapoznania się z programem. To powzwoli Ci zrozumieć na czym polega budowanie projektów w Apache Hop.
Potok to ciąg zadań. W naszym przypadku otworzy plik, zmieni dane, zapisze zmienione dane do pliku. Trzy różne zadania, nazwane w Hop transformacjami połączone przeskokami. W Hop organizujemy nasze prace w projekty a każdy z projektów ma swoje środowisko pracy. Projekt jest kontenerem wskazującym na konkretny katalog na dysku w którym będą nasze potoki i przepływy (o przepływach później).
Tworzymy projekt i środowisko projektu
Uruchamiamy GUI naszego ETL poprzez wykonanie pliku 'hop-gui.bat' w Windows lub 'hop-gui.sh' w Linux. Po otwarciu programu po prawej stronie pola z nazwą projektu masz ikonę 'p+'. Kliknij ją by utworzyć nowy projekt.

Wpisz nazwę projektu, tutaj mamy "Testowy projekt", i wskaż gdzie znajdować się będzie folder projektu. Kliknij OK. Mamy utworzony projekt. Następnym zadaniem jest utworzenie środowiska. Środowisko zawiera ustawienia które będą wykorzystywane przez nasze potoki i przepływy pracy. Np. połączenie do bazy danych. Dzięki temu zmieniając środowisko z którego korzystasz w danym przepływie czy potoku, łączysz się do różnych baz danych bez konieczności przepisywania transformacji. Używasz tego min. do łączenia się ze środowiskiem testowym lub produkcyjnym. Możesz też szybciej zbudować nowy potok bez konieczności ponownej definicji bazy danych.
Pierwsze kroki w Apache Hop
Apache Hop bazuje na Pentaho Data Integration (Kettle). Pierwotni twórcy zniecierpliwienie brakiem rozwoju Kettle postanowili wykorzystać kod Pentaho PDI (Kettle) w wersji 8.2 by zbudować nowy ETL w formule projektu Apache - Apache HOP. Hop kontynuuje podejście do przetwarzania danych znane z Kettle; pracujemy z danymi wizualnie, nie piszemy zupełnie kodu a jeśli nawet to bardzo rzadko.
Przetwarzanie danych w Hop polega na tworzeniu przepływyów pracy i potoków w wizualnym środowisku programistycznym o nazwie Hop Gui. Te przepływy pracy i potoki mogą być wykonywane na różnych silnikach: przepływy pracy i potoki mogą działać na natywnym silniku Hop, zarówno lokalnie, jak i zdalnie. "Potoki" można również uruchomić w Apache Spark, Apache Flink i Google Dataflow poprzez konfiguracje środowiska wykonawczego Apache Beam.
W przepływach pracy i potokach danych można zastosować setki operacji: odczytywać i zapisywać na różnych platformach źródłowych i docelowych, ale także łączyć, wzbogacać, czyścić i na wiele innych sposobów manipulować danymi. W zależności od silnika i wybranej funkcjonalności, Twoje dane mogą być przetwarzane wsadowo, strumieniowo lub hybrydowo wsadowo/strumieniowo.
Co mogę zrobić w Apache Hop?
Wszystko to co możesz zrobić w ETL. Kilka przykładów jak Apache Hop może pomóc ci w Twojej pracy:
-
Ładowanie dużych zestawów danych do baz danych z wykorzystaniem środowisk przetwarzania w chmurze, klastrowych i masowo równoległych.
-
Zasilenie hurtowni danych.
-
Integracja różnych architektur danych, łączenie relacyjnych bazy danych, plików, baz danych NoSQL, takich jak Neo4j, MongoDB, Cassandra itp.
-
Migracja danych pomiędzy różnymi bazami danych i aplikacjami.
-
Profilowanie i czyszczenie danych.