How graph databases help to manage customer journey
Customer’s journey isn’t a simple and finite series of steps: it’s a complex and sometimes contradictory set of interactions over multiple channels. A customer journey map is a visual representation of the customer journey - it helps to organize your company processes in the way customer will enjoy "seamless experience" with your brand across all touchpoints.
This is the point where we often hear about "customer experience". But customer experience is not a synonym of customer journey - this is a part of it.
Customer journey map
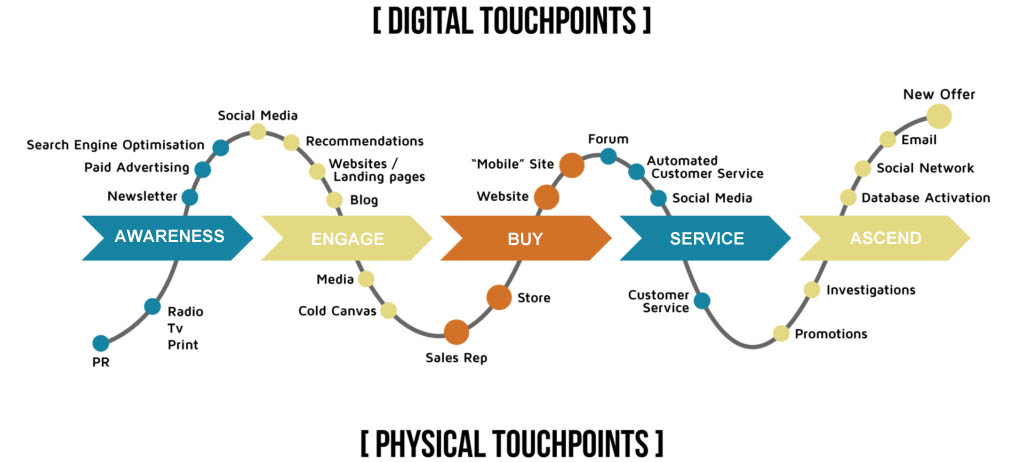
There is no single, official methodology or framework for creating visualization of the customer journey. The number of stages and areas with the company and clients' activities may also be different. But an average visualization that would allow you to find out the points of interaction with the client and properly audit these touchpoints could look like the graph below. In fact, today's customer path is not linear - it is rather a closed, repeating cycle of activities.
The context
Yet no matter what interaction we have with the client it should have proper context. Customer can move between channels, use different devices and be active in different touchpoints searching for product, buying, using services or rating the product or service. We all as customers like relevent and personalizd information. We feel disconnected when we deal with companies where at each contact we have to provide the right context. Just an example of lack of customer analytics across channels and touchpoints - we propose service augmentation to the client not event knowing that customer rated this service very low or even is about to unsubscribe it. So it is really important to identify opportunities, uncover gaps between channels and have overview of all touchpoints.
How graphs span across customer journey map
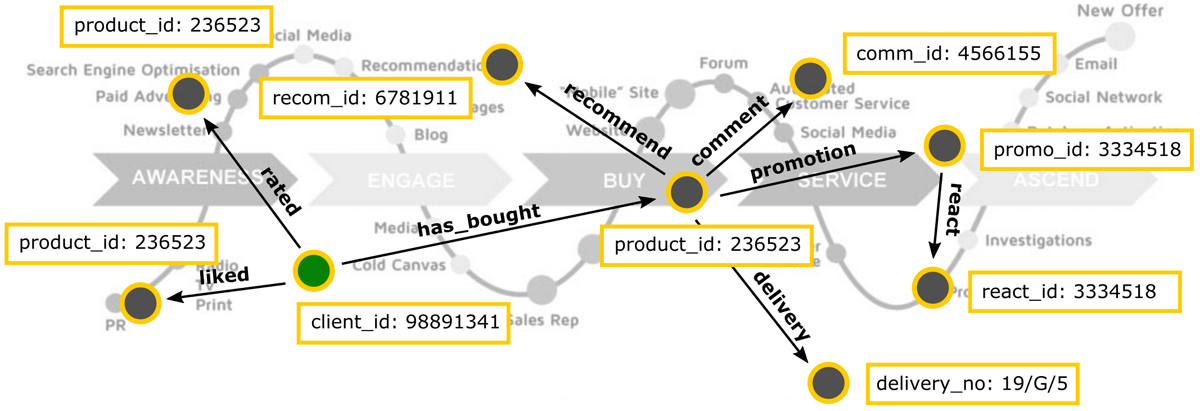
Since knowledge about each customer touchpoint, sales funnel, omnichannel activity is so critical there is an essential need for solution that will help to manage this complexity. A customer journey is built incrementally. You do not wait till the process ends. Client's activity changes dynamically so the data you collect also represent activity snapshot valid for some short moment of time. Client movement across a map creates natural graph model with its touchpoints as a nodes and relation properties. This approach to work with data is implemented in graph databases - solution to work with large sets of unstructured, rapidly changing information.
How graph databases can help deliver the right view
Today’s most pressing data challenges center around connections, not just "data". The real value – the real bottom-line, business-defining ROI – comes from the connections between the data that’s collected. Explore below the most common use cases and solutions powered by graph databases.
Customer churn
Product recommendation
There is nothing more irritating than an offer for products that we are not interested in. To make relevant recommendations requires the ability to correlate product, customer, inventory, supplier, logistics and marketing initiatives. Moreover, a real-time recommendation engine requires the ability to instantly capture any new interests shown in the customer’s current visit – something that batch processing can’t accomplish. Matching historical and session data is trivial for a graph database.
Personalized marketing
Pseudo-personalized emails, incoherent advertising, and randomly chosen "You might like it" links are more harmful than doing any good. Truly personalized promotions are based not only past buying history yet also current session data. Whoever wants to increase online sales must meet the expectations and tastes of the customers - ideally fulfilling their wishes before they could even express them. Companies have plenty of data that can be used to determine the best offers and content to the customers. However, this data often resides in information silos, making it difficult to consolidate and identify opportunities to serve customers the most relevant content. Graph technologies makes this task possible and offers speed not available for more traditional technologies.
Logistic operations
Graph theory has its roots in the logistics problem - whether it is possible to follow a path that crosses each bridge exactly once and returns to the starting point (Leonhard Euler)? The logistics network is a graph. The use of graph technology allows you to find the answer to the question "as soon as possible to deliver a parcel from A to B address?" but also to answer the question "how to organize transport to be the most cost-effective?". But even when you deliver the goods to the customer, you would like to know with what result and how it affects the customer satisfaction. Graph databases will help you add this puzzle to the customer journey.
Inspired by: Neo4j